I did some exercises for the IELTS test, in which we have to describe charts.
The first exercise had the following instructions: "The line graph below shows changes in the amound and type of fast food consumed by Australian teenagers from 1975 to 2000. Describe the information shown in the graph." We are supposed to write 60 to 70 words.
Chart
And here's what I've written:
"Between 1975 and 1995, there was a significant rise in the number of Australian teenagers eating pizza. Since then, it has held almost steady. There was also a drastic increase in those eating hamburgers, especially prior to 1985. The consumption of fish and chips went down slightly until 1980, and then up again for another five years, but finally, there has been a sharp decline since 1985."
The second text is about adult education. Here are the instructions: "
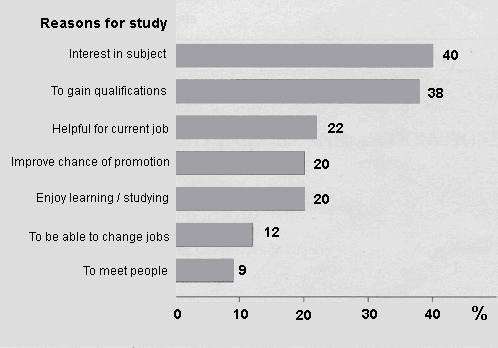
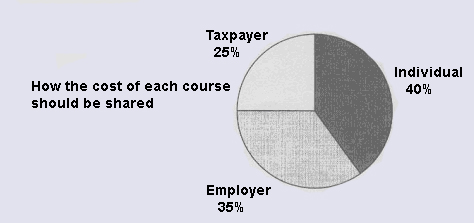
The charts below show the results of a survey of adult education. The first chart shows the reasons why adults decide to study. The pie chart shows how people think the costs of adult education should be shared. Write a report for a university lecturer, describing the information below. You should write at least 150 words."
Chart1 Chart2
And here's my text: "
According to a survey, the two most important reasons for adults to start studying are their interests in the subject and gaining qualifications, each being mentioned by about two fifths of those interviewed. Slightly more than a fifth thinks that further education might be helpful for their current job, closely followed by those who want to improve their prospects of promotion and those who enjoy learning and/or studying, each being cited by a fifth. Being able to change their jobs or meeting new people are the fewest mentioned reasons, with about 10% each.
As further education is seen as the key to better qualifications and thus more chances, it is not surprising that two fifths of the people suggest that students should have to pay the tuition fees by themselves. Slightly less hold the opinion that their employers should meet the costs. Only a fourth thinks that the taxpayers should foot the bill."
What do you think about my texts? Can you spot any errors? Or can you think of some improvements regarding style?
I would really appreciate any help. Thanks, Alex.
Describing Charts
-
karinne
Re: Describing Charts
Hi Alex,
First of all, I was very impressed with your English. You sound practically fluent; there were essentially no grammatical or spelling errors.
First of all, I was very impressed with your English. You sound practically fluent; there were essentially no grammatical or spelling errors.
Excellent job. Only a few phrases that didn't sound like a native speaker's, but none that sounded odd. Congratulations!Mra hat geschrieben: "Between 1975 and 1995, there was a significant rise "increase" is usually used with the adjective "significant," so that just sounds a tiny bit funny. Common phrases are "sharp rise," "significant increase," "spike," ... "sudden" is an adjective that is commonly used to describe all of those words. in the number of Australian teenagers eating pizza probably more common to say "who ate pizza," but no big deal. Since then, it hasheld almost steadyleveled off - held almost steady sounds a little awkward, although it's certainly not wrong. There was also a drastic increase in those eating hamburgers, especially prior to 1985. The consumption of fish and chips went down slightly until 1980, and then up again for another five years, but finally, there has been a sharp decline since 1985." I would just say "...went down slightly until 1980, and then up again for another five years. However, it has been sharply declining since 1985." We tend to say there is a decline/increase when it's something that happened in the past. However, if it's something that started in the past and continues to this day, we say has been declining/increasing since [date].
According to a survey, the two mostimportantcommon reasons for adults to start studying are their interests in the subject and gaining qualifications, each being mentioned by about two fifths of those interviewed. Slightly more than a fifth thinks we usually say "said" instead of "thinks" when discussing studies that further education might be helpful for their current job, closely followed by those who want to improve their prospects of promotion and those who enjoy learning and/or studying, each being cited by a fifth the blue part of the sentence is slightly unclear. Perhaps you could make it its own sentence. Being able to change their jobs or meeting new people are thefewestleast commonly mentioned reasons, with about 10% each.
As further education is seen as the key to better qualifications and thus more chances (by chances I think you mean "job opportunities?"), it is not surprising that two fifths of the people suggest that students should have to pay the tuition fees by themselves. Slightlylessfewer...but most English speakers do not use less and fewer properly anywayhold the opinion that their employers should meet the costs. Only a fourth thinks that the taxpayers should foot the bill."
-
Mra
Re: Describing Charts
Wow, karinne, you really flatter me.
I am always eager to improve my English, not only in terms of grammatical correctness, but also in style. I really appreciate all your annotations. If there is anything I can do for you, just let me know.
Thank you.
BTW:
I am always eager to improve my English, not only in terms of grammatical correctness, but also in style. I really appreciate all your annotations. If there is anything I can do for you, just let me know.
Thank you.
BTW:
Is "in" the correct preposition here or is there any better way of saying this?not only in terms of grammatical correctness, but also in style.
-
karinne
Re: Describing Charts
Is "in" the correct preposition here or is there any better way of saying this?
Hm. I just don't think I've ever heard prepositions used with the word "style" (except for a piece of clothing being "in style" but that's a different situation). You may just say "I am always eager to improve my English, not just my grammar, but also my style." "In terms of correctness" and "in terms of style" also works, it's just not as concise.
Good luck on the IELTS test! What is the exam like? Is it similar to the TOEFL?
-
Mra
Re: Describing Charts
Thank you. I don't know exactly what the test will look like. I started studying English at university this semester and the two texts were just some exercises we had to do for homework. Our professor didn't mention anything about the exam so far.karinne hat geschrieben:Good luck on the IELTS test! What is the exam like? Is it similar to the TOEFL?
-
karinne
Re: Describing Charts
I see. Well, once again, good luck! As I said, your English seems proficient. If you have any other assignments in the future, I'd be glad to look at them
-
Mra
Re: Describing Charts
Here's another text I've just written for practice.
Task:
The table below shows social and economic indicators for four countries in 1994, according to United Nations statistics. Describe the information shown below in your own words. What implications do the indicators have for the countries?
You should write at least 150 words.
Table
And my text:
The chart compares four countries based on social and economic factors. On the one hand, there are the developed countries, Canada and Japan, where in 1994 the average income was $11,100 and $15,760, respectively. In the poor countries included on the table, however, people earned almost a hundred times less, namely $160 in Peru and $130 in Zaire.
Another indicator given suggests that the life expectancy at birth is also higher in affluent countries than in developing countries. Among the four countries mentioned, the Japanese were expected to get oldest (78 years), closely followed by the Canadians with only two years difference. In contrast, Peruvians and Zairians would only live two thirds of that time (51 and 47 years).
In the same way, the amount of daily consumed calories is much higher in rich countries than in poor ones. While the figures for Canada and Japan were around 3,000 calories a day, Peruvians and Zairians took in less than 2,000.
Furthermore, the literacy rates among adults are much higher in developed countries. Almost everybody knows how to read and write, there. By contrast, only slightly more than two thirds of the people in Peru and one third in Zaire are able to do so.
What do you think about it? Is it well enough structured? Are there any improvements I can undertake? I don't mind at all if you are a little bit strict on me.
-
karinne
Re: Describing Charts
Here we go!
In the poor countries included on the table, however, people earned almost a hundred times less, namely $160 in Peru and $130 in Zaire.
--->In the poor countries included on the table, however, people earned almost a hundred times less: $160 in Peru and $130 in Zaire.
the life expectancy at birth is also higher in affluent countries than in developing countries. Among the four countries mentioned, the Japanese were expected to get oldest (78 years), closely followed by the Canadians with only two years' difference.
-->Life expectancy is also higher in affluent countries than in developing countries. Among the four countries mentioned, the Japanese had the longest life expectancy at 78 years, and the Canadians were only two years behind.
Let me know if you have questions
Two suggestions for style improvement:The chart compares four countries based on social and economic factors.On the one hand, On one hand. It's "On one hand, .........." but "On the other hand, ......." there are the two developed countries, Canada and Japan, where in 1994 the average income was $11,100 and $15,760, respectively. nice use of "respectively"In the poor countries included on the table, however, people earned almost a hundred times less, namely $160 in Peru and $130 in Zaire.
Another indicator given suggests thattake this out, as you don't specify what the indicator is. You might start out with "The chart also indicates that...." the life expectancy at birth is also higher in affluent countries than in developing countries. Among the four countries mentioned, the Japanese were expected to get oldest (78 years), closely followed by the Canadians with only two years' difference. In contrast, Peruvians and Zairians would only live two thirds of that time (51 and 47 years).
In the same way, the amount of daily consumed calories is much higher in rich countries than in poor ones. While the figures for Canada and Japan were around 3,000 calories a day, Peruvians and Zairians took in less than 2,000.
Furthermore, the literacy rates among adults are much higher in developed countries, where almost everybody knows how to read and write, there. "There" is too specific a word here and would not have a comma preceding it. By contrast, only slightly more than two thirds of the people in Peru and one third in Zaire are able to do so.
What do you think about it? Is itwell enoughstructured well enough? Are there any improvements I canundertakemake? I don't mind at all if you are a little bit strictonwith me.
In the poor countries included on the table, however, people earned almost a hundred times less, namely $160 in Peru and $130 in Zaire.
--->In the poor countries included on the table, however, people earned almost a hundred times less: $160 in Peru and $130 in Zaire.
the life expectancy at birth is also higher in affluent countries than in developing countries. Among the four countries mentioned, the Japanese were expected to get oldest (78 years), closely followed by the Canadians with only two years' difference.
-->Life expectancy is also higher in affluent countries than in developing countries. Among the four countries mentioned, the Japanese had the longest life expectancy at 78 years, and the Canadians were only two years behind.
Let me know if you have questions
-
Duckduck (Contributor)
Re: Describing Charts
Hi karinne,
wieder eine tolle Korrektur, von der wir alle - egal wie weit wir sind - erneut etwas lernen können! Danke!
Allerdings habe ich eine kleine Anmerkung zu diesem Teil:
Grüße sendet
Duckduck
wieder eine tolle Korrektur, von der wir alle - egal wie weit wir sind - erneut etwas lernen können! Danke!
Allerdings habe ich eine kleine Anmerkung zu diesem Teil:
Ich bin sicher, dass im BrE durchaus "on the one hand" gesagt wird. Insofern müsste man eben sehen, ob der gesamte Text eher BrE oder AmE ist, um die Korrektur jeweils anzupassen.On the one hand, On one hand. It's "On one hand, .........." but "On the other hand, ......."
Grüße sendet
Duckduck
-
Mra
Re: Describing Charts
@ karinne:
Thanks, you were really helpful.
I've found various discussions on the Internet regarding the article in "on the one hand". It seems that there is a little bit of a disagreement among native speakers.

The Corpus of Contemporary American English, however, includes the phrase "on the one hand" four times as often as its counterpart without the article. If you take the British National Corpus, it's hardly used at all without the article. Maybe it's both a regional difference and the speaker's/writer's choice?
Thanks, you were really helpful.
I've found various discussions on the Internet regarding the article in "on the one hand". It seems that there is a little bit of a disagreement among native speakers.
The Corpus of Contemporary American English, however, includes the phrase "on the one hand" four times as often as its counterpart without the article. If you take the British National Corpus, it's hardly used at all without the article. Maybe it's both a regional difference and the speaker's/writer's choice?
-
karinne
Re: Describing Charts
Hm I suppose so. Now that you mention it, I believe I have occasionally heard "on the one hand...." when the phrase is being particularly emphasized, although where I am "on one hand" is much more common.
Just one of those things, I guess!
Just one of those things, I guess!